Traces
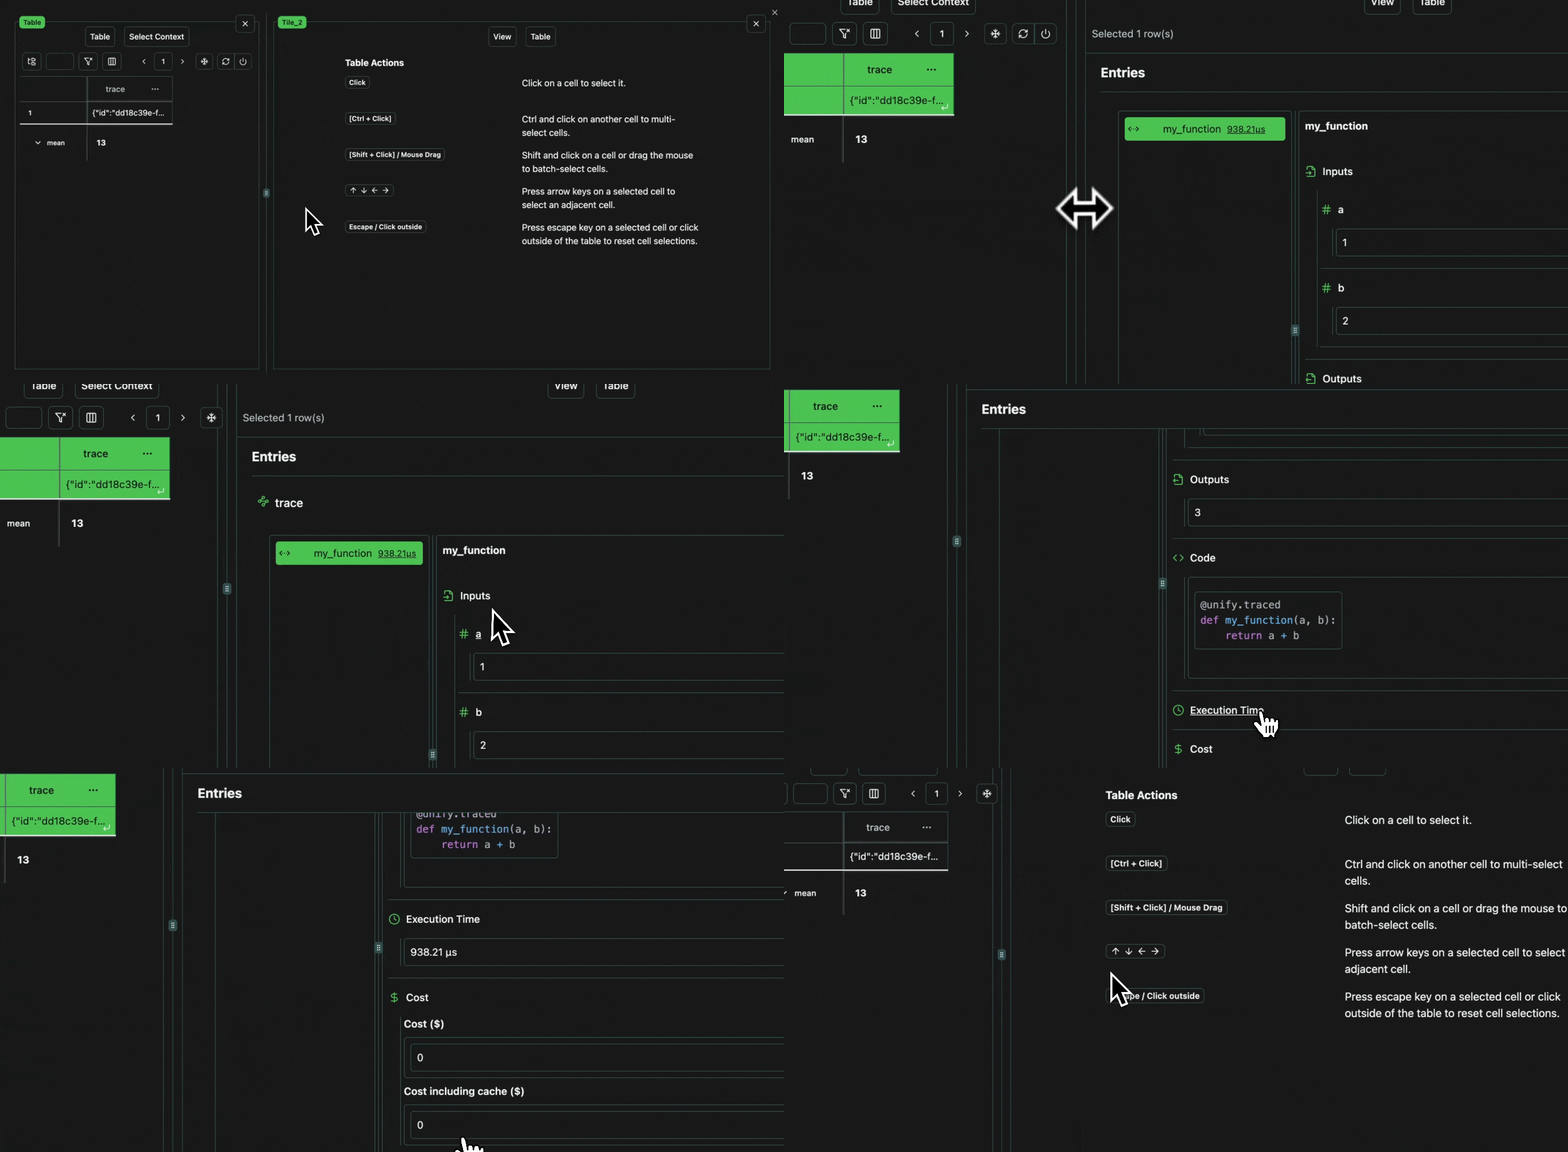
You can easily trace any function using the unify.traced
decorator.
If you create a view tile and select the trace in the table, you’ll then see the trace viewer.
Expand
Expand
click image to maximize
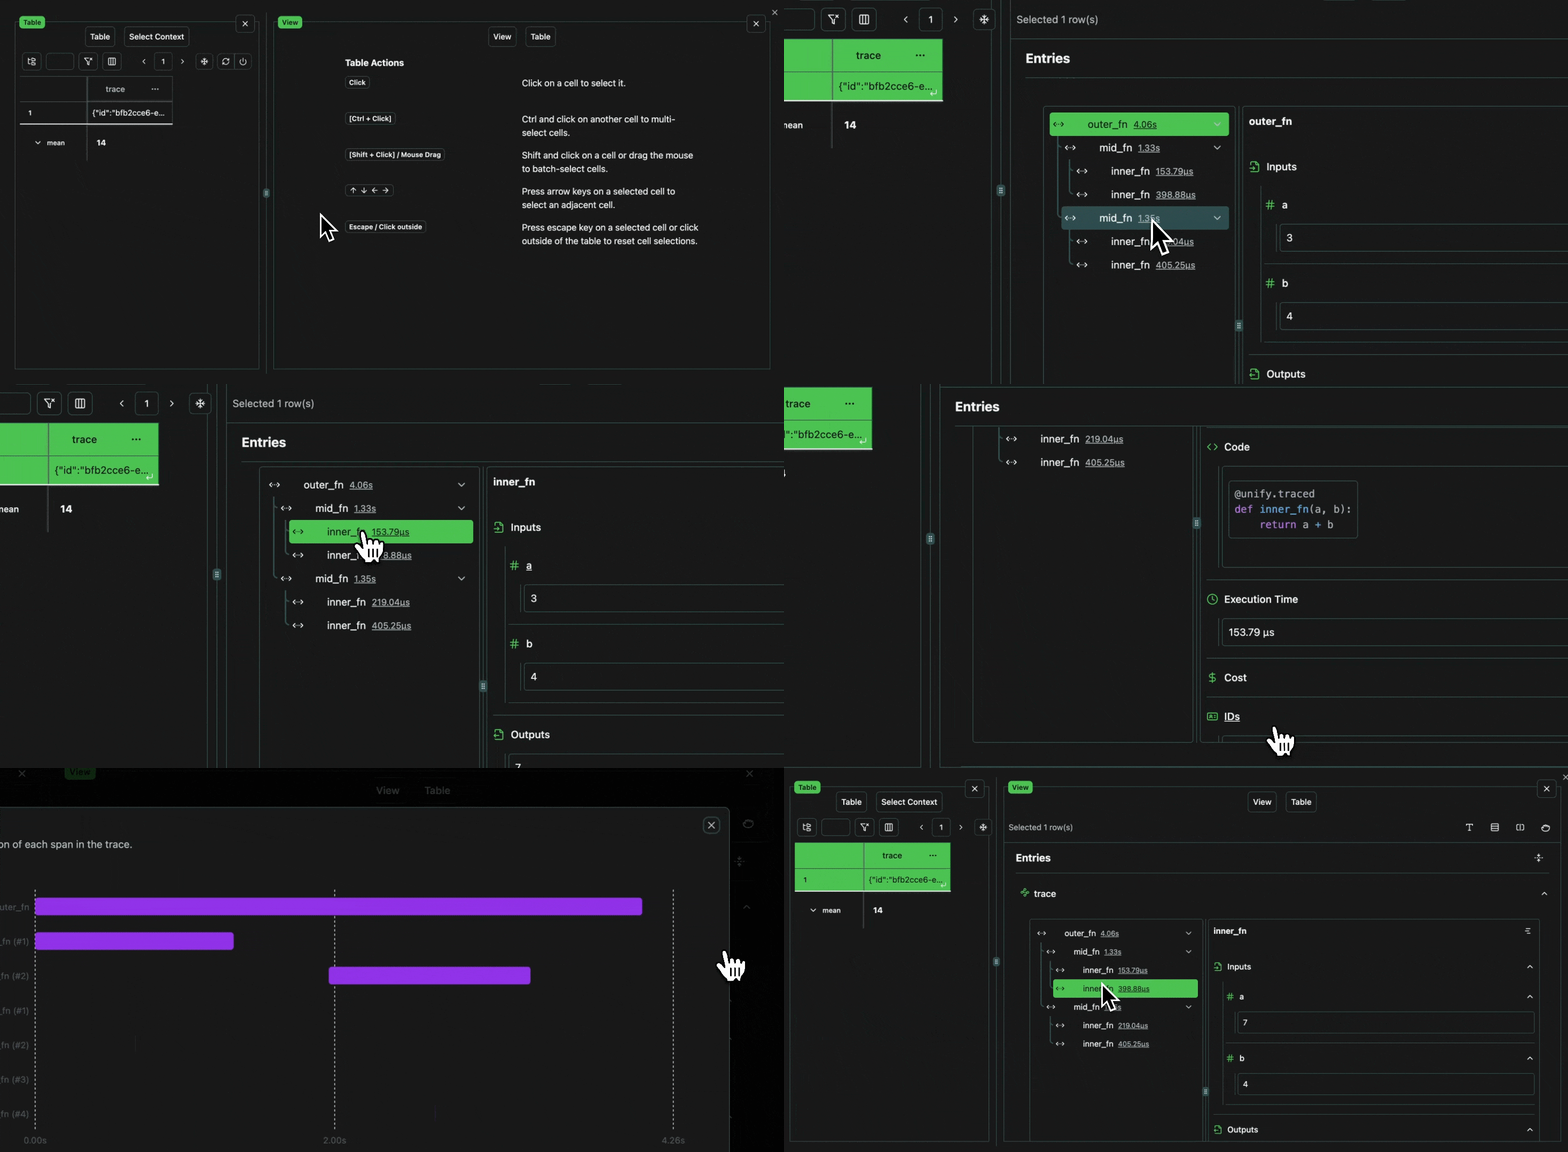
Traces are made up of spans, each of which represent a unit of computation. Traces can have an arbitrary number of spans, and spans can have child spans up to an arbitrary depth.
In the trace view pane, this will look as follows:
Expand
Expand
click image to maximize
LLM Traces
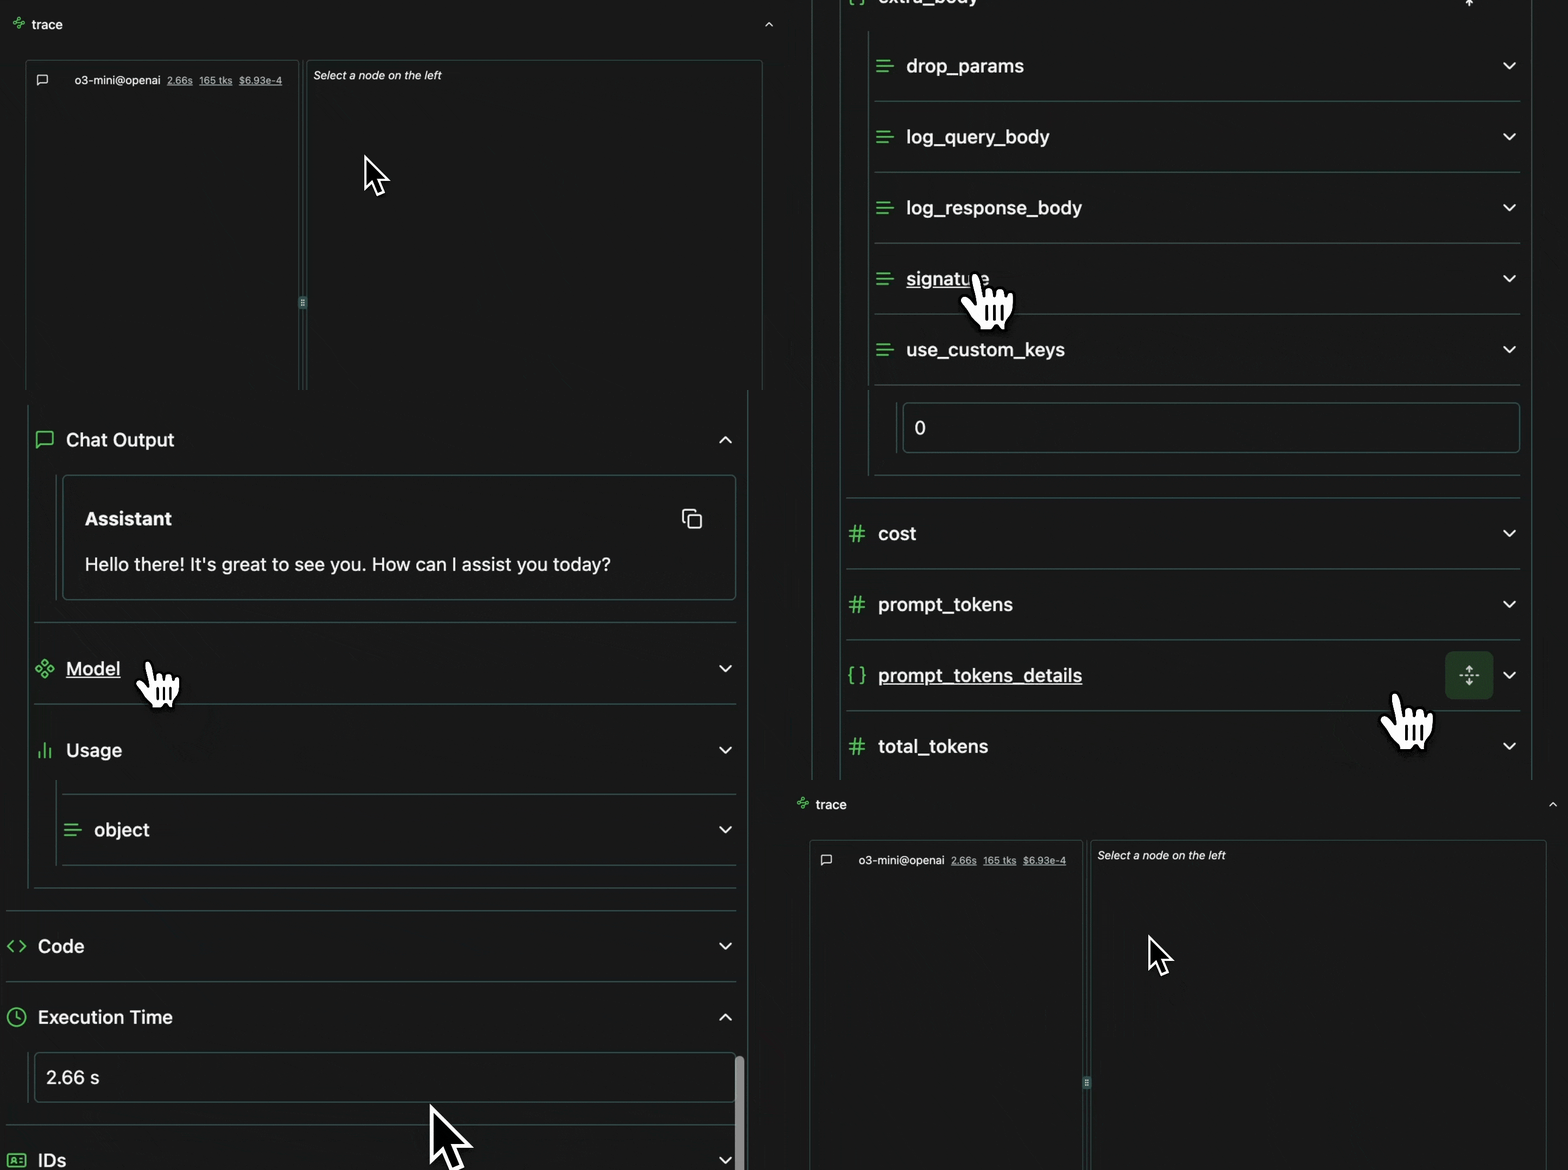
LLMs can also be traced, by setting traced=True
in the client constructor (see Universal API section).
Expand
Expand
click image to maximize
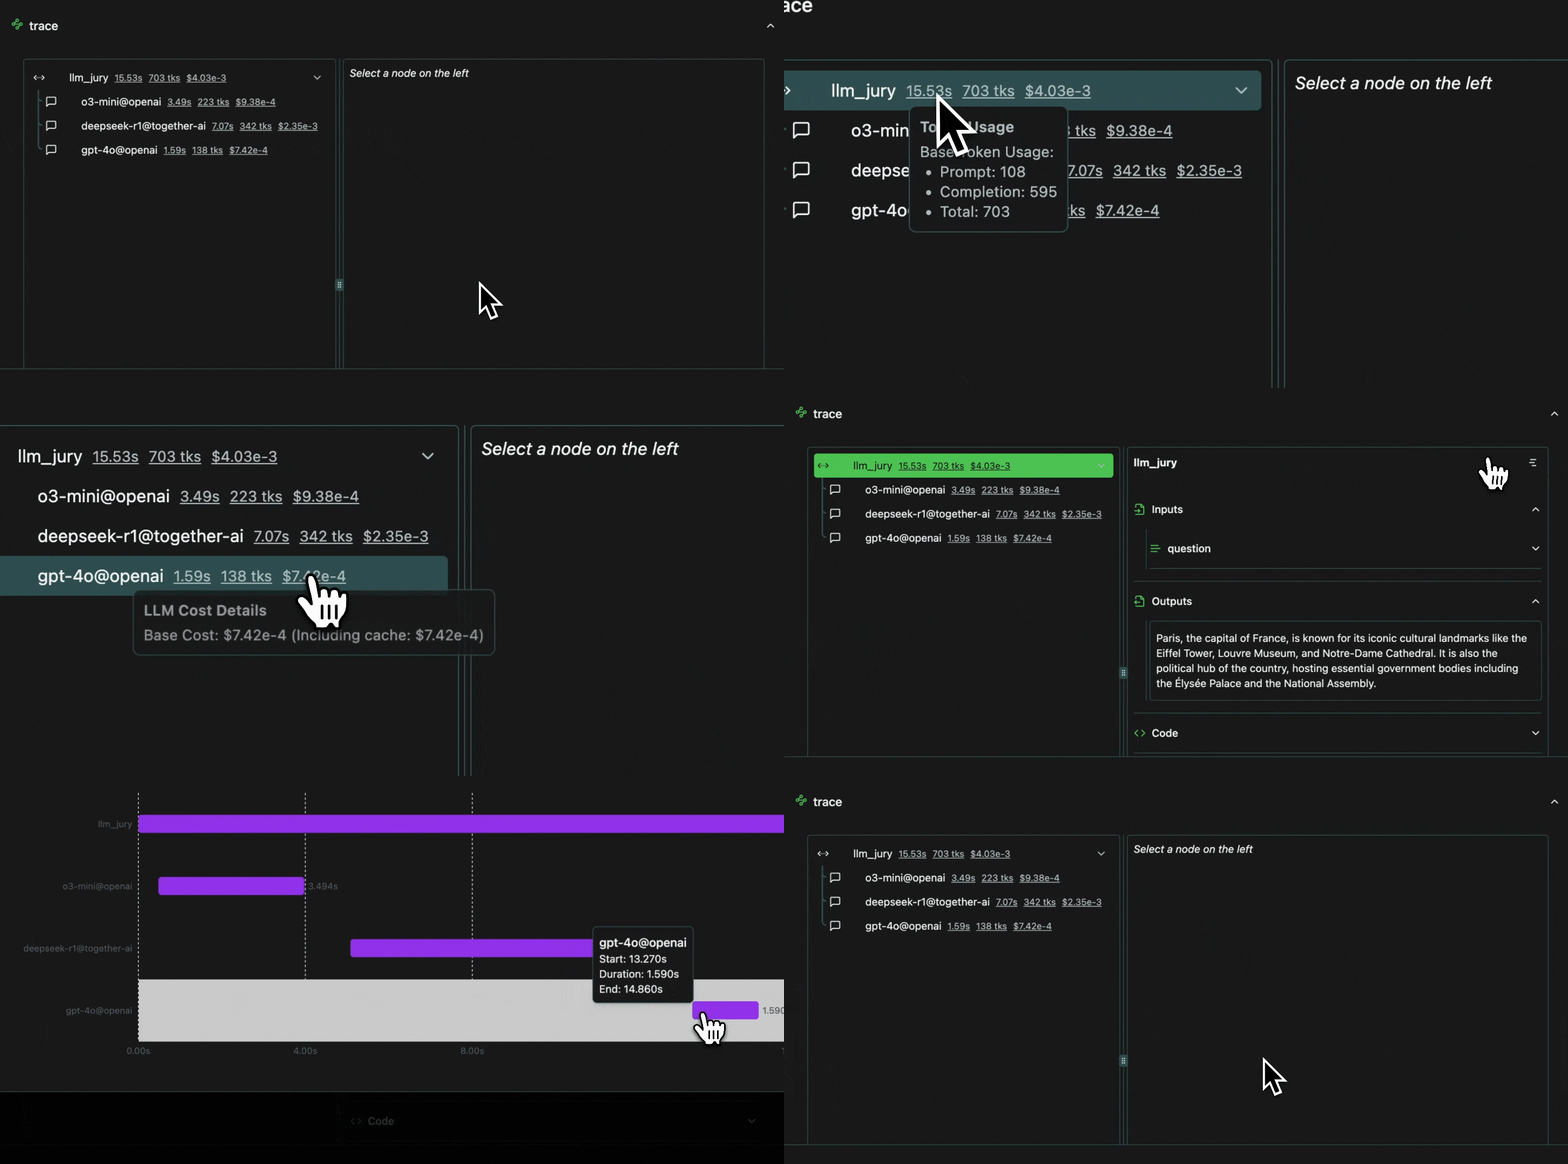
When these LLM calls are part of a broader trace, then the cost and tokens are accumulated in the trace, propogating the cost and tokens to the parent spans.
Expand
Expand
click image to maximize