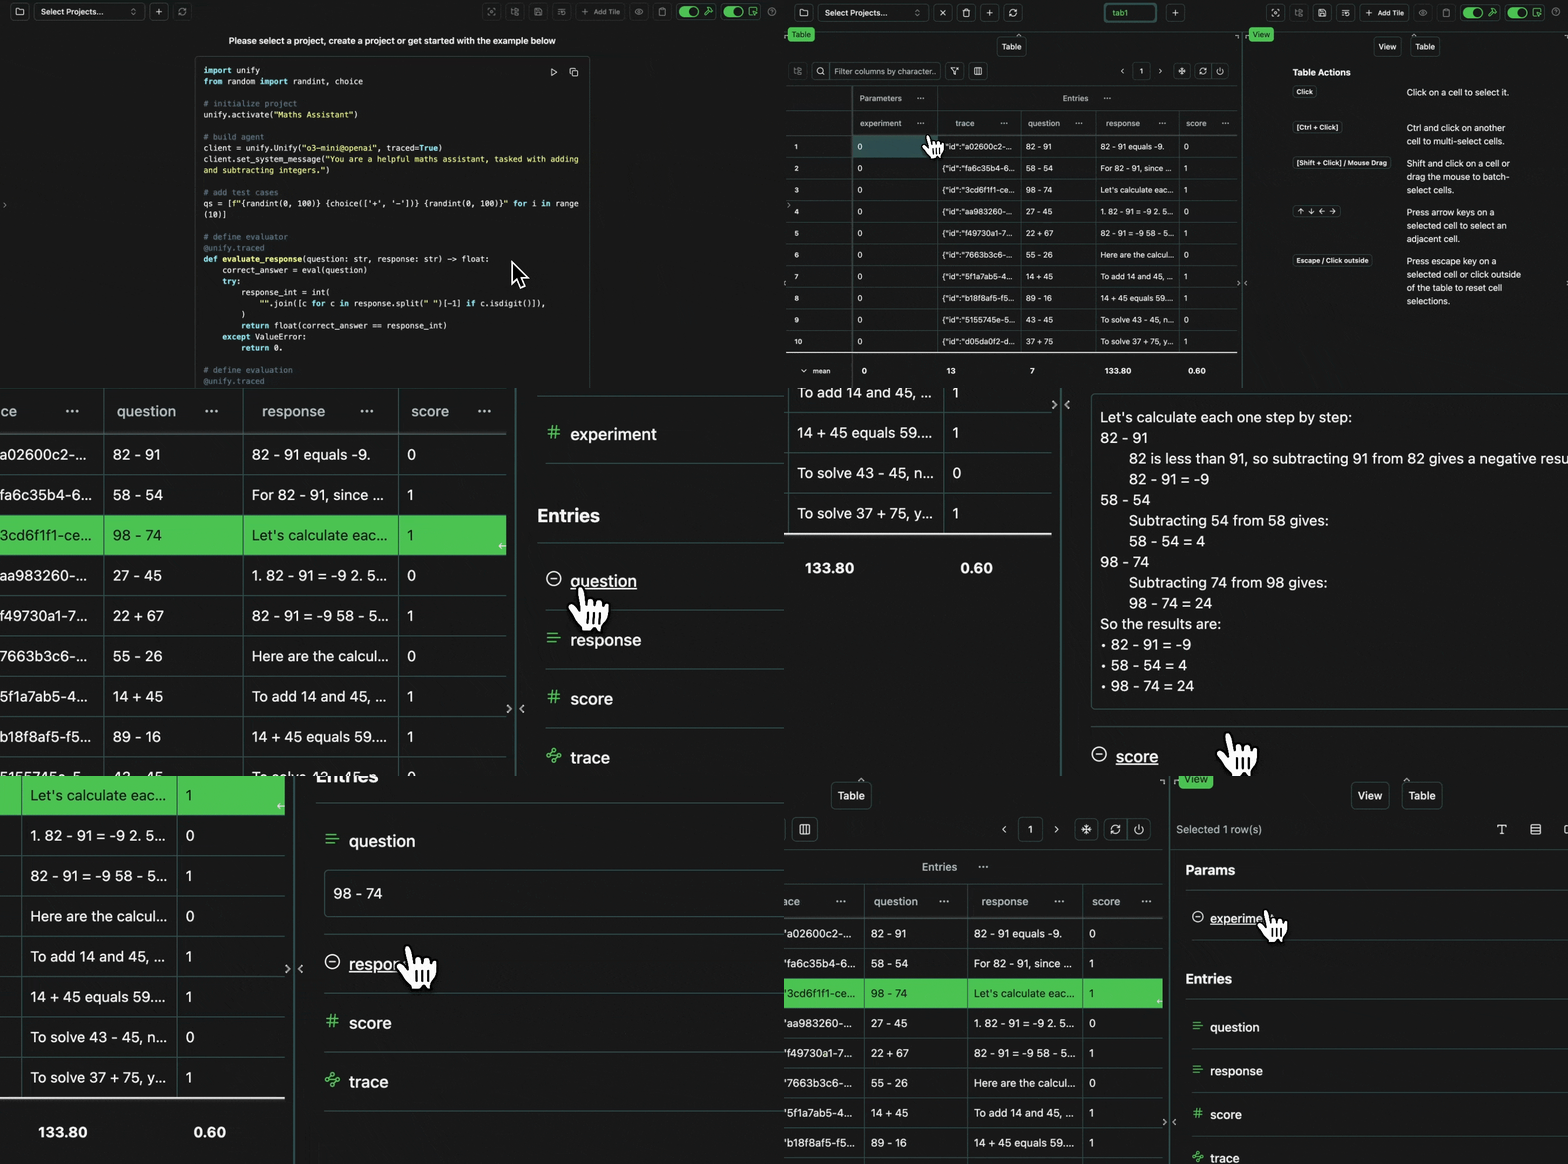
tab1) and two tiles (Table on the left and View on the right).

Tabs
Tabs are shown at the top centre of the screen, and an interface can have as many tabs as you want. Tabs are useful for separating different concepts and data views within a project, for example:Datasets, Usage, Evals, Metrics, Tests etc.
Each tab can be tailored for it’s specific purpose, making it easy to juggle all aspects of your project 🤹🏼
Tiles
Tabs consist of tiles, which is where the data, interaction, and visualization actually happens. There are four types:- tables 🔢
- views 🔍
- plots 📊
- editor 🕹️ (coming soon)
Expand
Expand
 click image to maximize
Focus Mode
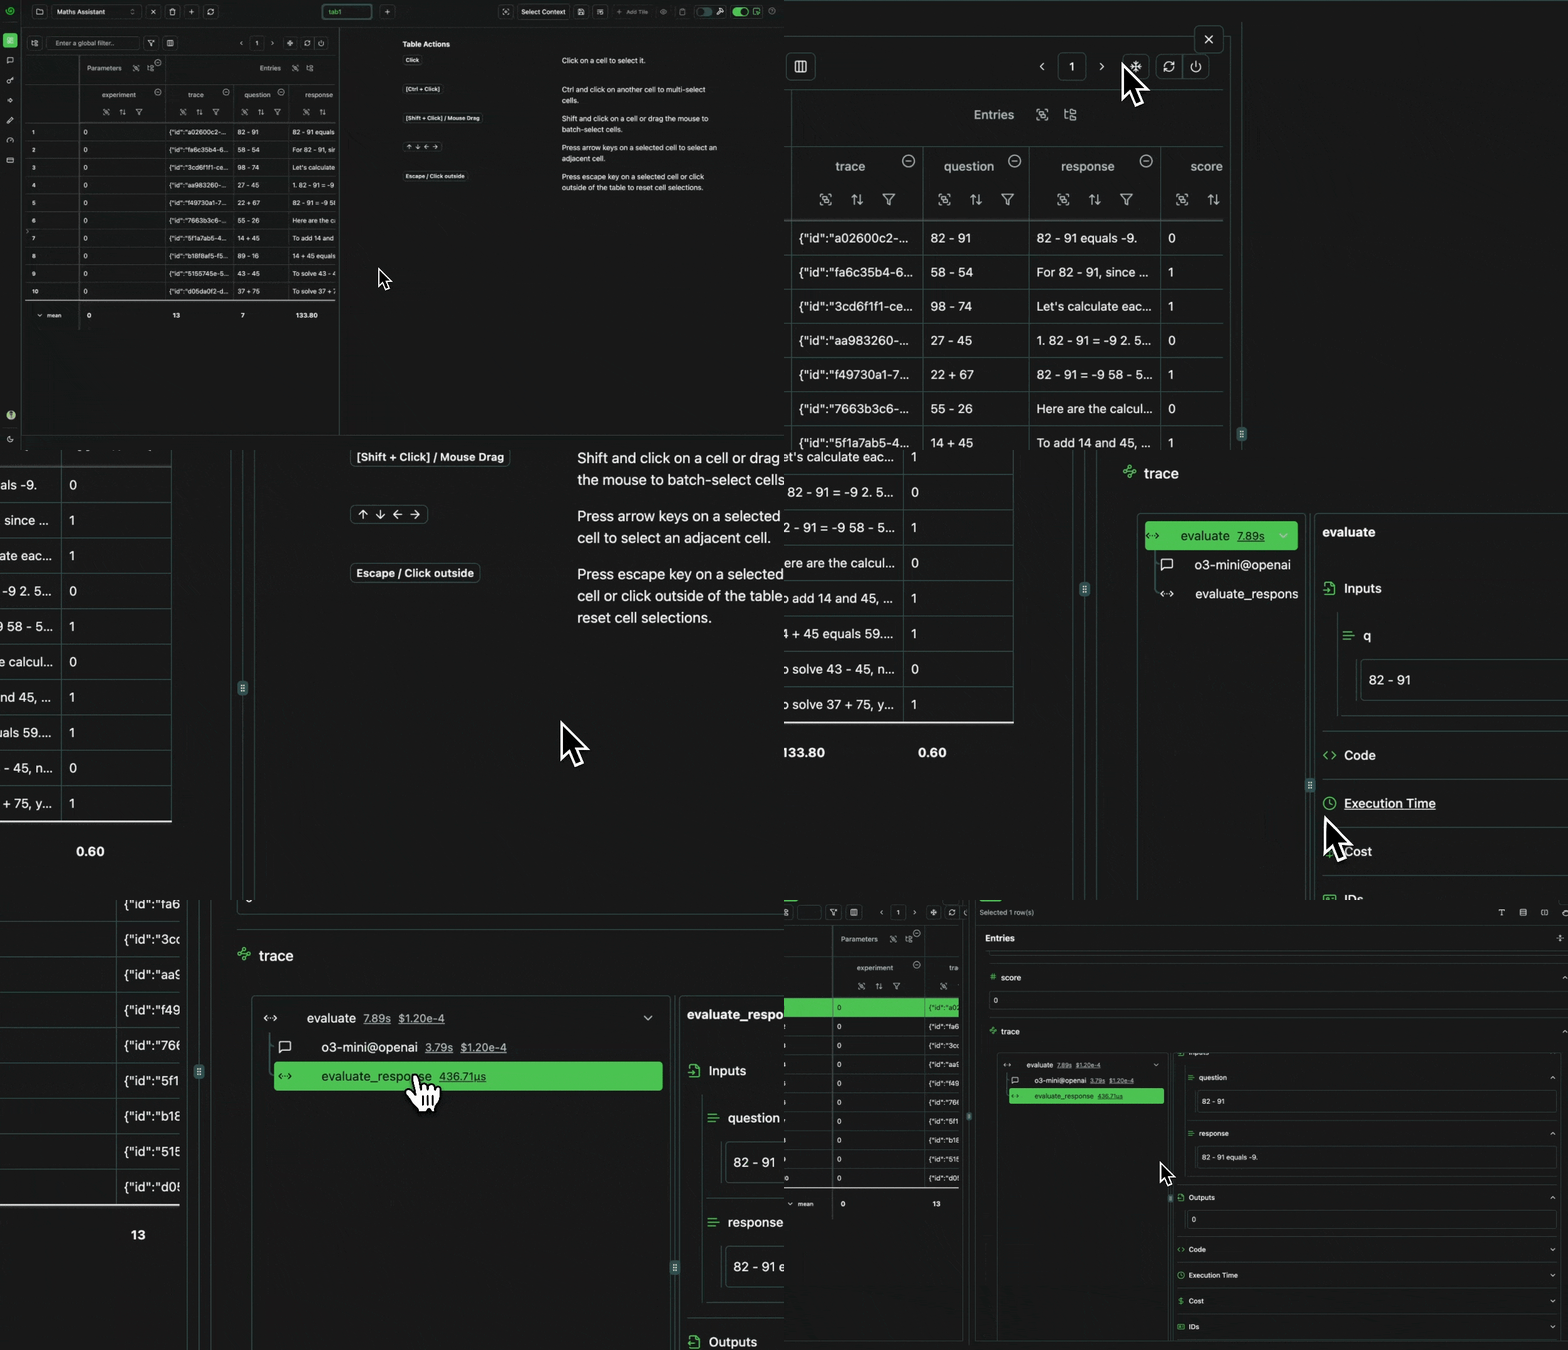
If you want to look at one tile in particular, you can expand this into the focus mode view, by clicking the expand button in the top right of the tile. This will open the tile in focus mode, where other tiles can be positioned alongside for comparison, or the single tile can occupy the full screen by dragging the central divider to the side. You can exit via the top right “X” button to return to the default interface view.Expand
Expand
 click image to maximize
Edit / Interactive Modes
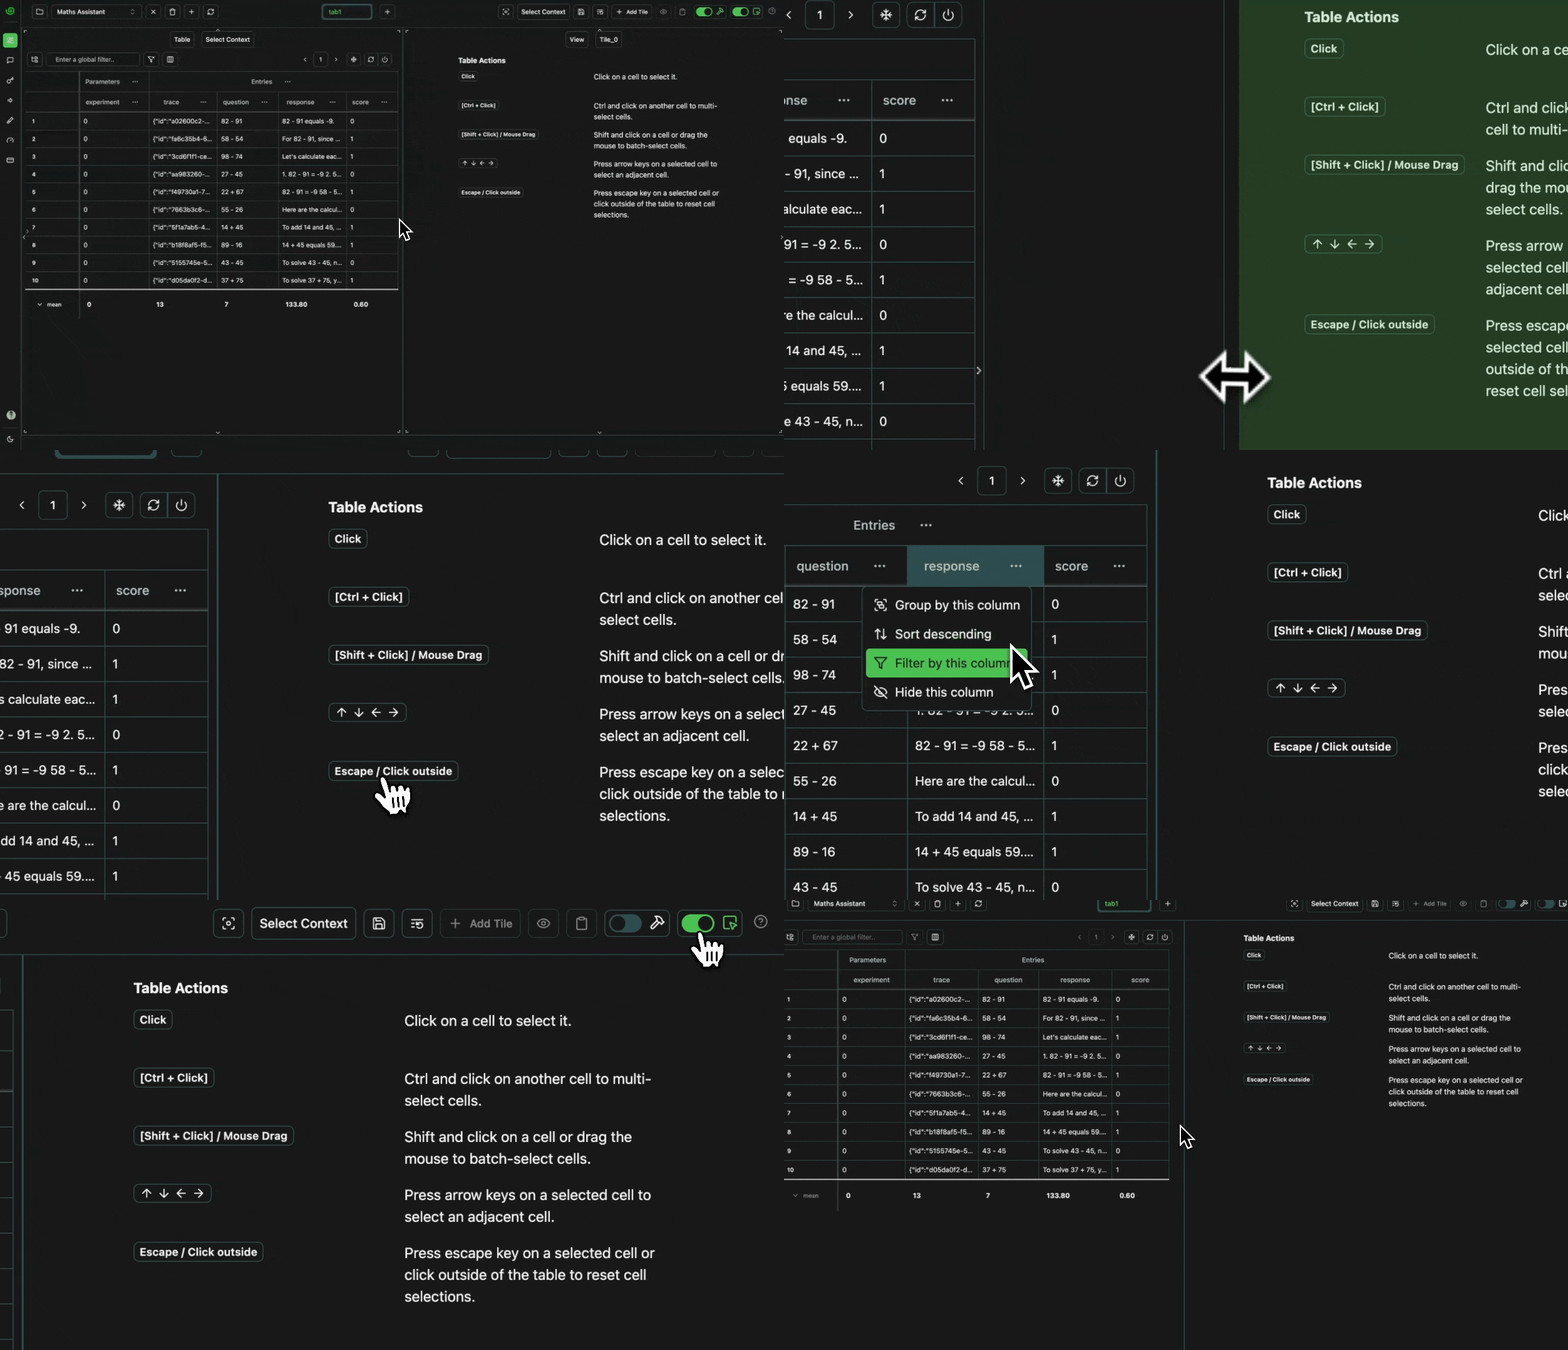
Edit mode enables tile manipulation (as explained above) and interactive mode enables engagement with the tiles, such as applying filters, sorting and grouping on tables, changing the axes selection on plots, and editing logs via the view tile. When interactive mode is turned off, the interface acts more like a static dashboard, with data manipulation features disabled.Expand
Expand
 click image to maximize
Contexts
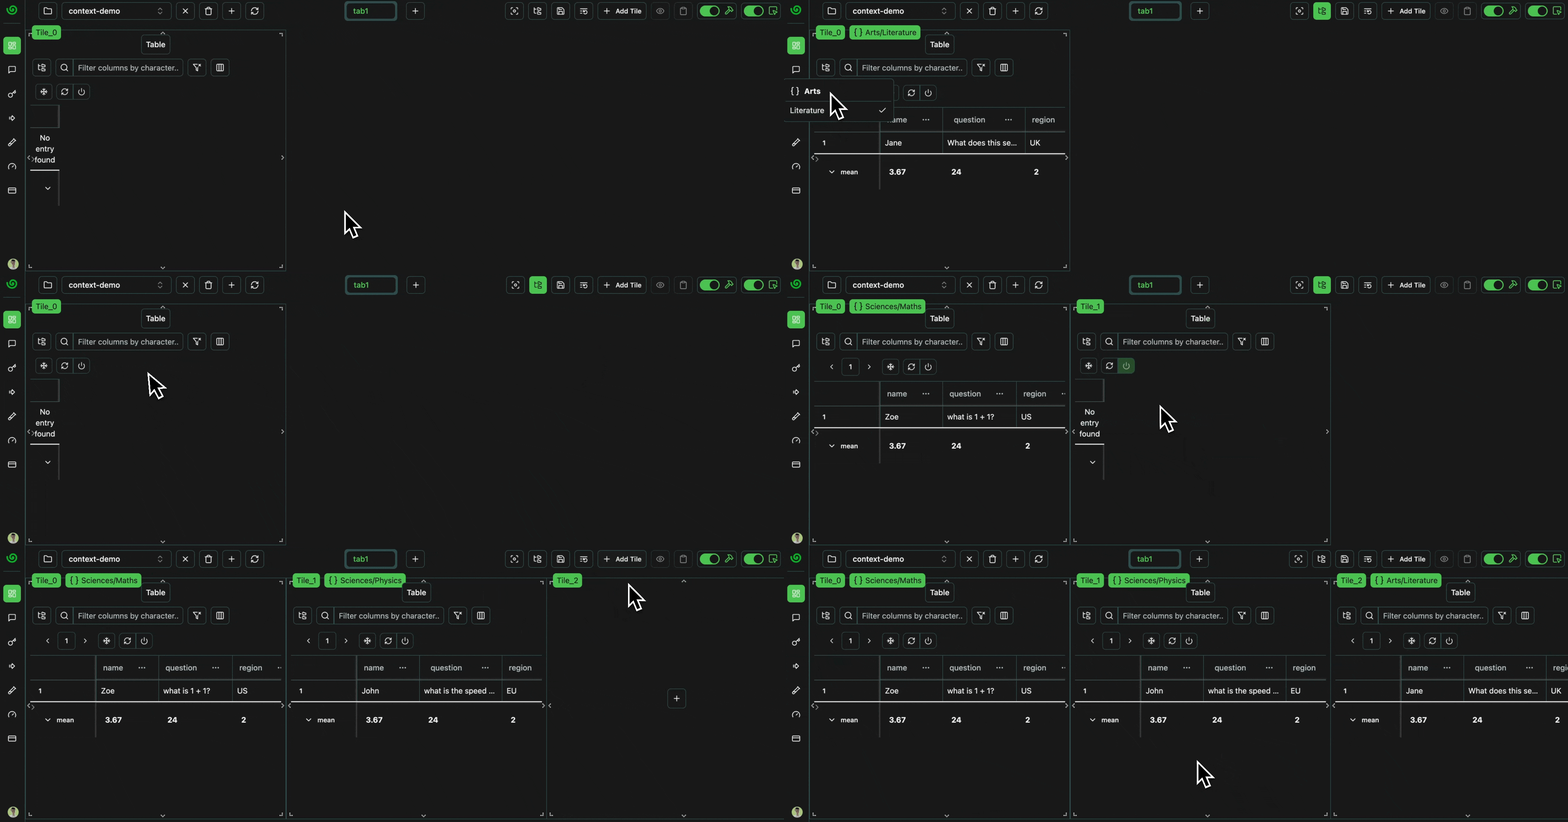
Contexts enable you to compartmentalize your data for different tables or for different tabs within your interface. The context for an entire tab can be set in the top right, either by selecting a context subdirectory for tables to choose from, or setting the context itself. In the former case, tables will then be limited either to contexts within the selected context subdirectory, and in the latter case the tables will all share the same globally set context. It’s best to showcase this with an example: Open in your consoleExpand
Expand
 click image to maximize